Product
Engineering
Factory Analytics
By Factory - March 11, 2026 - 3 minute read -
Share
How enterprise engineering teams use Factory Analytics to connect AI agent usage to engineering outcomes and build the ROI case.
Product
Engineering
By Factory - March 11, 2026 - 3 minute read -
Share
How enterprise engineering teams use Factory Analytics to connect AI agent usage to engineering outcomes and build the ROI case.
"How has AI actually accelerated my organization?"
It's the question behind every enterprise AI investment review. Token counts and API calls don't answer it. Leadership wants to know whether developers are more productive and whether the cost is justified.
Factory Analytics makes the ROI case concrete. Platform teams and engineering leaders gain visibility into how Droids are being used across their organization, what it costs, and the output they produce. It tracks six areas of agent usage and impact: token consumption, tool usage, activity and adoption, productivity output, per-user breakdowns, and agent readiness.
Every metric is built on OpenTelemetry, so organizations can export to their existing observability stack or use Factory's hosted dashboards directly.
Factory Analytics has been live for enterprise customers since early 2026. Here's how engineering teams are using it.
Tokens
The tokens view tracks consumption, grouped by model, user, or date range. Engineering teams can see exactly where token spend is going, which models are being used most, and how usage trends day over day. This helps leaders understand how developers are allocating models across their workflows.
Teams may use more cost-efficient models like GLM-5 or Kimi-K2.5 for execution, while reserving frontier models such as Opus 4.6 for higher-level work like spec creation.
The dashboard breaks down Factory Standard Credits, input and output volumes, and cache efficiency.
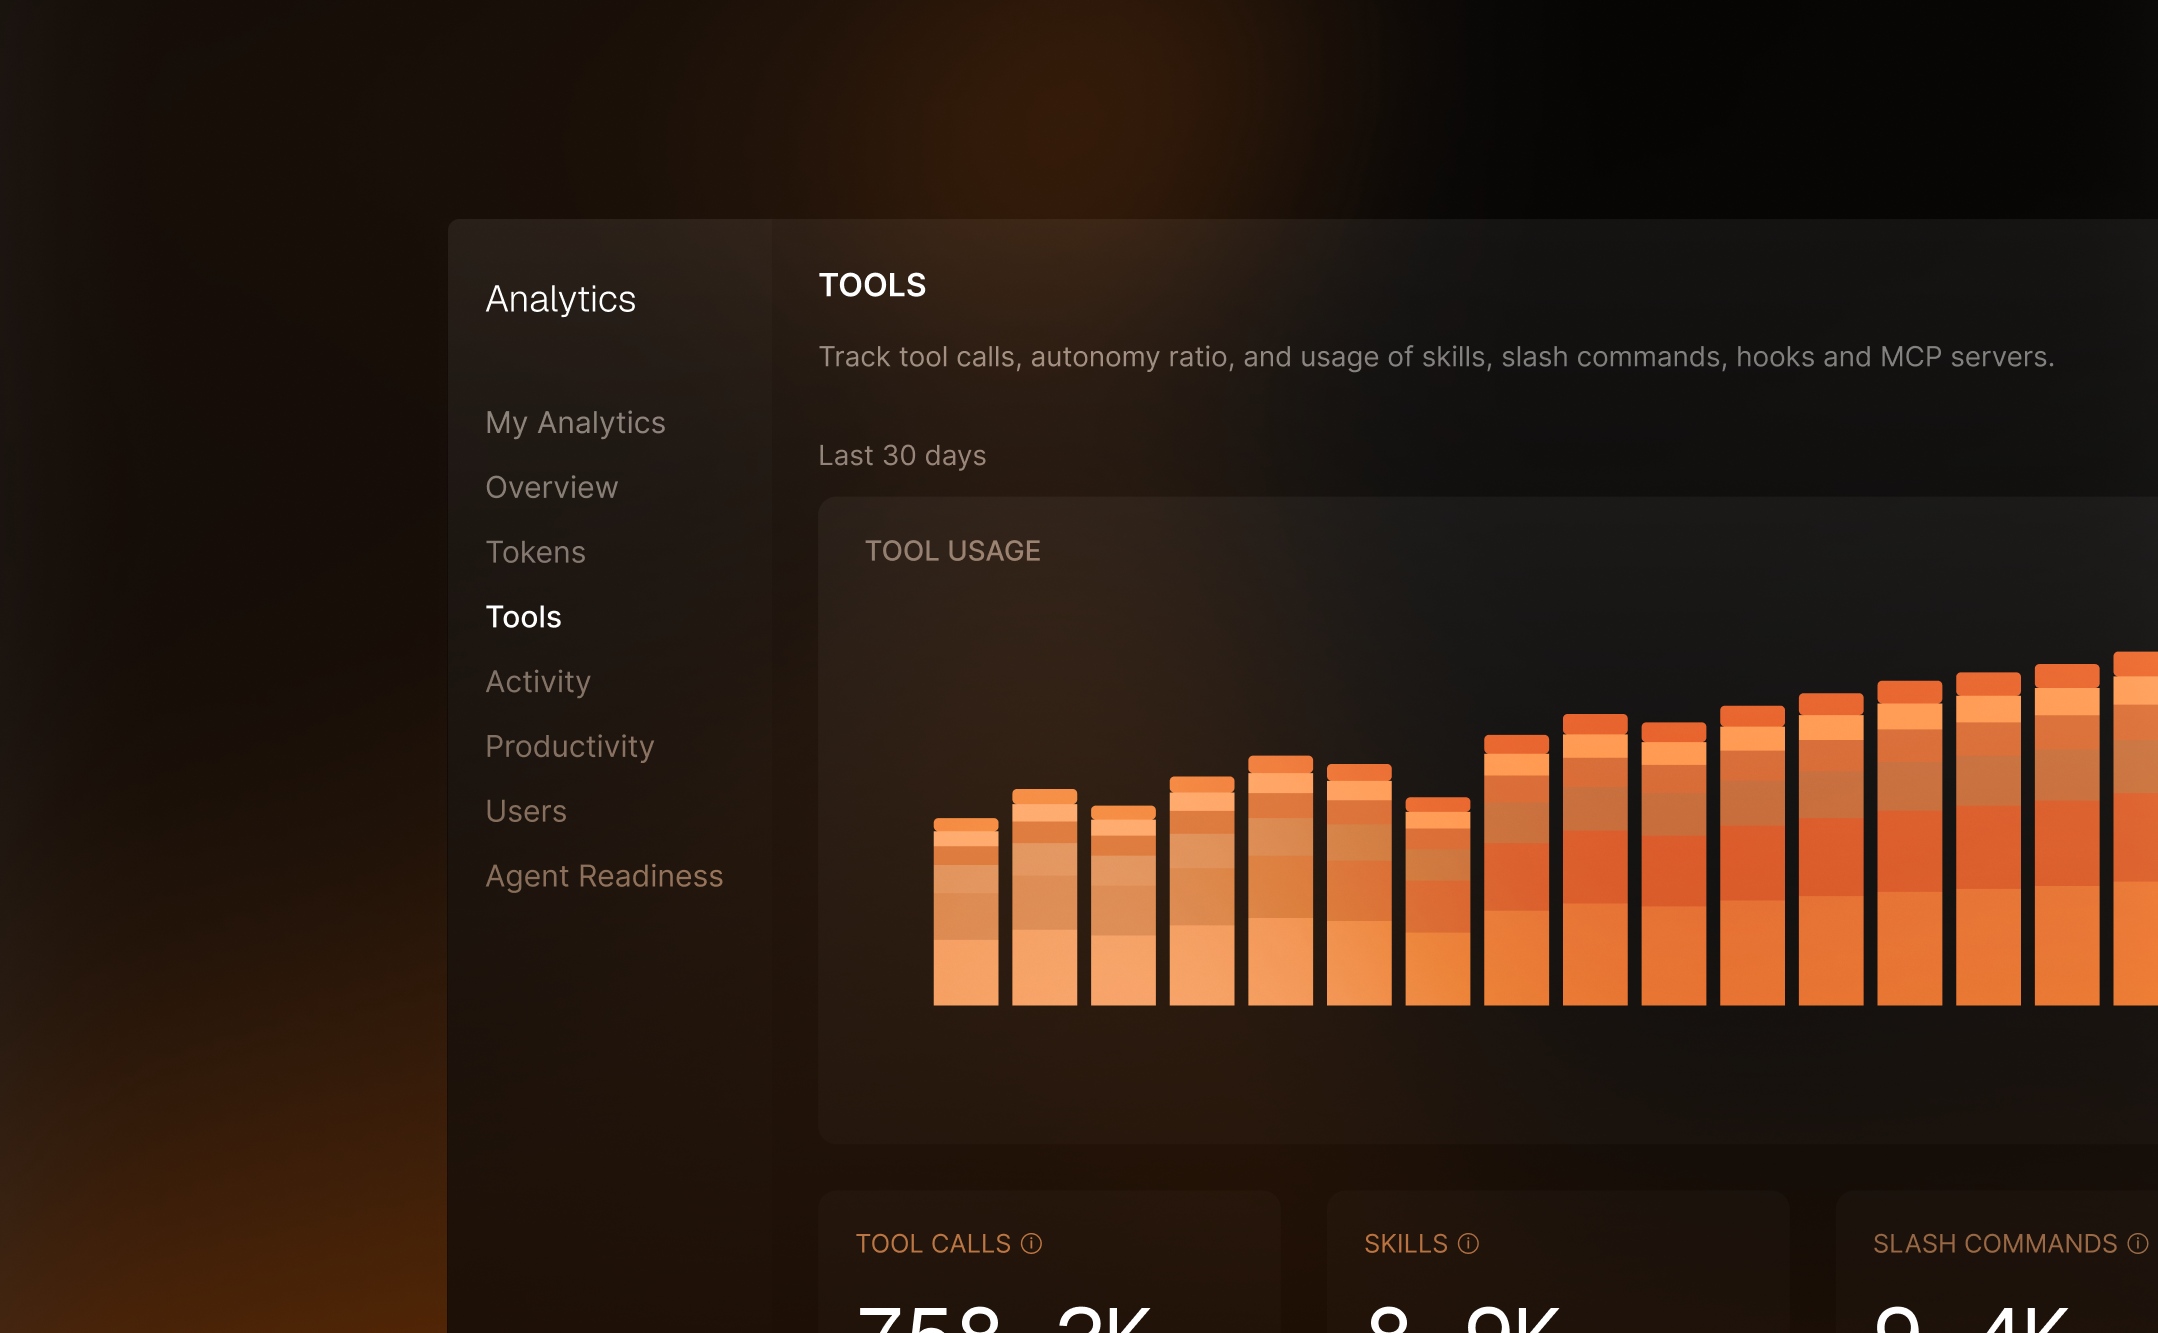
Tools
The tools view answers how Droids are actually being used.
It tracks tool calls by type: Read, Edit, Execute, Grep, Glob, and everything else. Beyond raw counts, it surfaces platform feature adoption: skills invocations, slash commands, hooks, and how many users have configured MCP servers. As engineering organizations move toward a more autonomous SDLC, adoption of these features is a leading indicator of effective usage.
The delegation section shows autonomy patterns. The autonomy ratio, tool calls per user message, indicates how much independent work Droids perform between human interactions. For example, a ratio of 13x means Droid executes thirteen tool calls for every user message. That number says something meaningful about how your developers trust and use the tool.
Activity
The activity view tracks adoption across the organization.
It measures daily, weekly, and monthly active users, along with sessions and messages over time. It also provides a client breakdown that shows whether users work in the terminal CLI, non-interactive CI mode, or web workspaces.
Stickiness, the ratio of daily to monthly active users, indicates whether AI tooling has become embedded in the daily workflow or is something people use occasionally. Session duration and message volume show depth of engagement. Together, these metrics answer one of the most important questions about adoption across your team.
Productivity
The productivity view measures code output directly: files created, files edited, language distribution, git commits, and pull requests.
When leadership asks "what did we get for our AI spend?" the answer is concrete: 4,500 files created, 129,000 files edited, 3,500 commits, 484 pull requests. All broken down by language and tracked over time.
The file operations and git activity charts show trends that correlate with adoption. As teams ramp up, code output typically increases in a pattern that matches the adoption curve in the activity view.
Users
The users view provides per-person breakdowns. Days active, tokens consumed, tool calls, sessions, and messages for each user in the organization. Search by email, sort by any column, and export aggregated or daily metrics.
This enables platform teams to identify power users, find developers who may need enablement support, and build the per-seat economics case. Combined with productivity data, it answers questions like "which developers produce the most pull requests per token consumed?"
Droids can consume the Analytics API directly. Ask it to generate a monthly ROI report, compare team adoption, or summarize productivity trends. Several enterprise customers already use this pattern for recurring leadership updates.
Droids can pull from Jira or Linear alongside the Analytics API to tell outcome stories about specific project delivery. Pull request throughput mapped to ticket completion. Token spend on a specific Linear project tied to story points completed, giving you a per-point cost of AI assistance.
A team doubled its PR merge rate in the same sprint it ramped up Droid usage. Droids can find patterns like this, package them, and generate the leadership narrative automatically.
The API makes this straightforward. Each endpoint maps to a question:
/analytics/activity — is my org using Droid?/analytics/tokens — what are we spending?/analytics/productivity — what is being shipped?/analytics/tools — how is Droid being used?Droids call these endpoints, join the data with your project tracker, and write the report.
“Is my org using Droid?”
{
  "dau": 156,
  "wau": 295,
  "mau": 418,
  "stickiness": 0.37,
  "sessions": 247,
  "sessions_avg_duration_minutes": 18.5
}Factory Analytics is available today for Enterprise plan customers. API access, OTEL export, and AI-generated reports are included.
The hosted dashboard at app.factory.ai/analytics provides filtering, date range selection, and CSV export.
For organizations that prefer their existing observability tools, OTEL export sends all metrics to Datadog, Grafana, New Relic, Splunk, or any OTLP-compatible collector. If your engineering org already has a central observability platform, the data flows there.
start building
Start building

